Author: David Draper, Ph.D., Associate Director, Scientific Development
Date: February 2022
Transcriptomic profiling can be used to examine the interaction between the tumor microenvironment (TME) and the immune system and is a powerful tool to investigate the mechanistic action of immunotherapies. In this Tech Spotlight, we demonstrate how gene expression measured in solid tumors using the nCounter® PanCancer IO 360™ panel (NanoString Technologies) can be combined with flow cytometry to provide a comprehensive evaluation of the effects that immunotherapy has on the anti-tumor immune response.
The PanCancer IO 360™ panel is a 770-plex gene expression panel that includes 48 distinct gene signatures to examine cancer-related immune responses. Analysis with the IO 360™ panel provides an unbiased and holistic approach to the examination of the tumor-infiltrating immune cells, tumor cells, and the associated microenvironment. To demonstrate the utility of NanoString analysis when applied to preclinical research, anti-mPD-1 (programmed cell death 1) therapeutic antibody was administered into mice bearing MB49 tumors, which is a murine model for bladder cancer. Flow cytometry was performed to target specific biomarkers for various pro- and anti-tumor activities in different immune subsets. We combined the cytometry and IO 360™ panel results to add an unbiased component to the analysis and provide a global immuno-oncology gene expression profile of the TME in treated versus untreated animals.
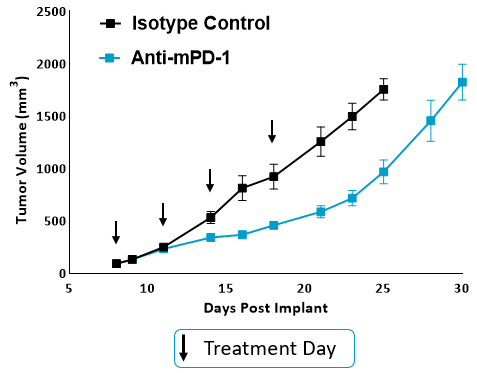
Figure. 1. Tumor growth curves for anti-mPD-1 and isotype control treated mice. MB49 cells were implanted subcutaneously into the axilla region. Anti-mPD-1 antibody (clone RMP1-14) was administered IP twice weekly for a total of 4 doses. Tumor progression was monitored by caliper measurements.
Flow cytometry analysis of MB49 tumor-infiltrating immune subsets
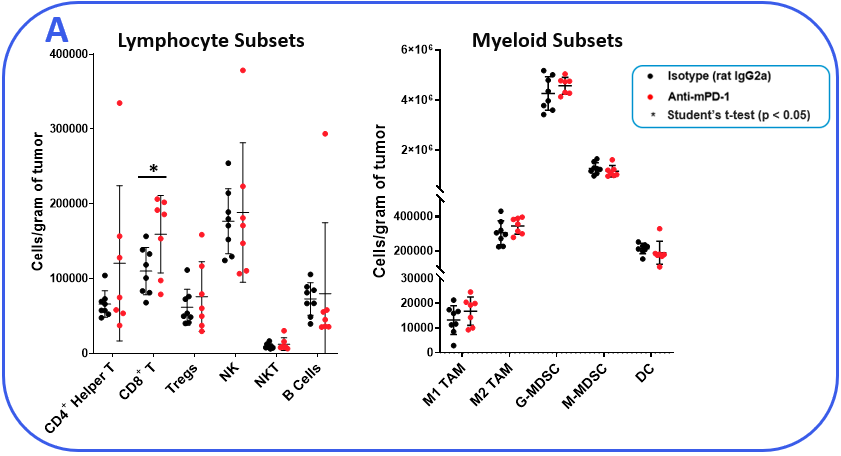
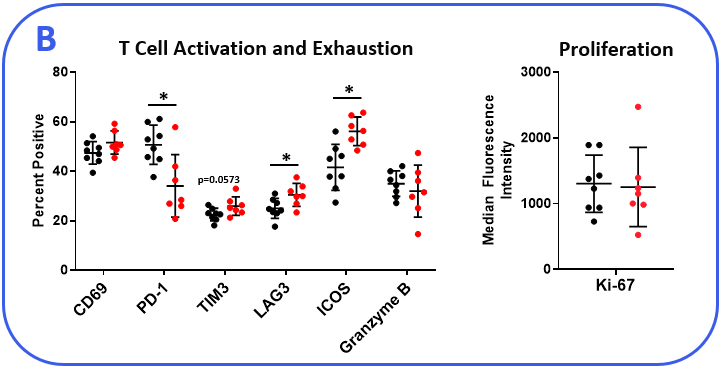
To determine if the MB49 model is responsive to checkpoint inhibition, tumor-bearing mice were treated with anti-mPD-1 or isotype control antibodies. Tumor growth curves shown in Figure 1 demonstrate MB49 tumors are moderately responsive to anti-mPD-1 treatment. Anti-mPD-1 therapy controls tumor growth by targeting the PD-1/PD-L1 axis to enhance T cell anti-tumor activity. To analyze the anti-mPD-1 effects in the MB49 model, flow cytometry was performed to examine absolute counts and the phenotype of tumor-infiltrating T cells and other subsets. Among the subsets measured, only CD8+ T cells were increased compared to control animals (Figure 2A). To gain insight into the activity of the CD8+ T cells, surface expression of activation markers CD69, inducible co-stimulator (ICOS), and granzyme B was measured. To assess T cell proliferation, intracellular expression of Ki-67 was quantified. Finally, markers that correlate with T cell exhaustion, including PD-1, lymphocyte activation gene 3 (LAG-3), and T cell immunoglobulin and mucin-domain containing-3 (TIM-3) were measured (Figure 2B). Tumor-infiltrating T cells expressed enhanced levels of ICOS in anti-mPD-1 treated animals compared to controls, which is a receptor that provides costimulatory signals to T cells and promotes their expansion and survival1. Notably, anti-mPD-1 treatment also modulated T cell exhaustion markers, with an observed reduction in PD-1 expression but increased LAG-3 and TIM-3 levels in treated animals. Flow cytometry was also used to measure targets associated with myeloid cell subset activity. iNOS and ARG1 proteins mediate immunosuppressive activity in myeloid-derived suppressor cells (MDSC)2. The expression of both proteins also correlate with tumor-associated macrophage (TAM) polarization, with iNOS and ARG1 being markers for M1 and M2 TAM polarization respectively2. Flow analysis demonstrated iNOS, but not ARG1 expression, was higher in TAMs from anti-mPD-1 treated animals compared to controls. No significant changes in the expression level of ARG1 was observed in tumor-derived TAMs, granulocytic (G-), or monocytic (M-) MDSC subsets between groups. CD80 and CD86 are costimulatory molecules on antigen presenting cells that provide activation signals to T cells and are often measured as biomarkers for antigen presentation capacity in dendritic cells (DC). We measured CD80 and CD86 on DC1 and DC2 cells, which are the predominant conventional dendritic cell subsets at work in the tumor and found anti-mPD-1 did not enhance the expression of these costimulatory molecules. In fact, CD80 expression was reduced in the in the DC2 subset from treated animals (Figure 2C).
Leerraum
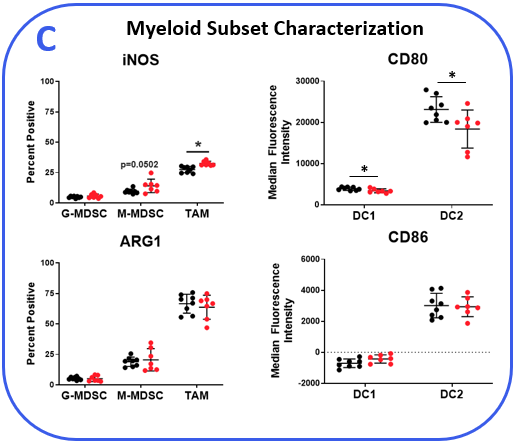
Figure 2. MB49 tumors were harvested from anti-mPD-1 and isotype control antibody treated mice. (A) Tumor-infiltrating immune subsets were delineated using flow cytometry with standard gating strategies (not shown). Absolute counts were determined using CountBright™ beads (Thermo Fisher Scientific). (B-C) Functional characterization of lymphocyte and myeloid immune subsets by flow cytometry. DC1 and DC2 subsets were delineated based on positivity for CD103 and CD11b markers respectively in the total DC fraction. * Student's T Test (p<0,05).
Gene expression in MB49 tumors using the nCounter® PanCancer IO 360™ panel
To gain transcriptomic insight into the effects of anti-mPD-1 treatment in the MB49 TME, mRNA was extracted from FFPE blocks prepared from tumors harvested 12 days after the start of treatment. Sample analysis was conducted on the NanoString nCounter® platform with the mouse PanCancer IO 360™ panel. Analysis powered by ROSALIND™ Bioinformatics determined that 62 of the 770 genes examined were differentially expressed between the anti-mPD-1 and isotype control antibody treatment groups. Furthermore, pathways analysis of the 48 gene signatures examined by the IO 360™ panel assigned a global significance score to assess the overall level of differential expression for each gene set. Gene sets that were most extensively modulated are displayed in Table 1, which included interferon signaling, cytotoxicity, and cytokine and chemokine signaling signatures. Notably, all the modulated genes included in these sets were upregulated in the anti-mPD-1 treatment group. Figure 3 portrays these gene sets in a heatmap format to help visualize the effect anti-mPD-1 treatment had on gene expression. 9 of the 61 genes that make up the interferon signaling gene set were differentially expressed between treatment groups. Notably, most genes that were modulated in this list were mediators of STING pathway signaling and included Ifih1, Stat1, Ifit1, Ifit2, Ifit3, and Irf73,4. 10 of the 50 genes that make up the cytotoxicity gene set were differentially expressed and also included several of the STING pathway associated genes. 14 of the 106 genes that compose the cytokine and chemokine signaling gene set were among the 62 genes modulated by anti-mPD-1 treatment. Included in the list were genes that promote T cell survival (Il2rb, Il21r, Il7r, Il10ra), as well as DC and T cell recruitment to the tumor (Ccl4, Ccl5, Ccr5)5-8. Further analysis of the data demonstrated that M1 macrophage profiles were increased (Nos2, Tlr8, Tlr9, Stat1)9. Finally, genes that code for known clinical targets for immunomodulation were increased (Ido1, Tim3, and Csf1r) indicating an effort in the TME to counteract the effects of anti-mPD-1 treatment.
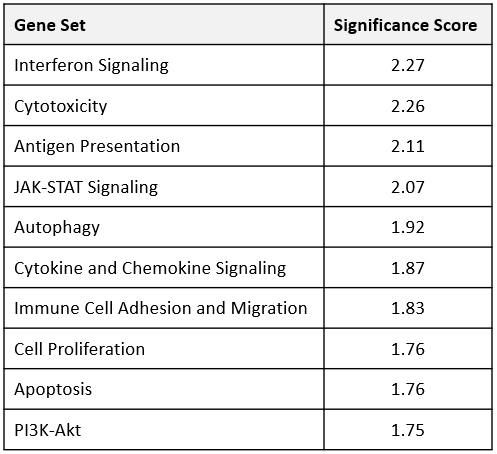
Table 1. Gene set analysis of MB49 tumors from anti-mPD-1 and isotype control treatment groups. RNA extracted from FFPE tumor samples were analyzed using the mouse PanCancer IO 360™ panel. ROSALIND was used to measure differential expression between 48 gene sets coded into the IO 360™ panel. Global significance scores (GSA) to measure overall differential expression within the gene sets were calculated using the NanoString Advanced Analysis module, which factors the t-statistic for each gene against each sample in the study. The GSA is then calculated as the square root of the mean squared t-statistic of genes.
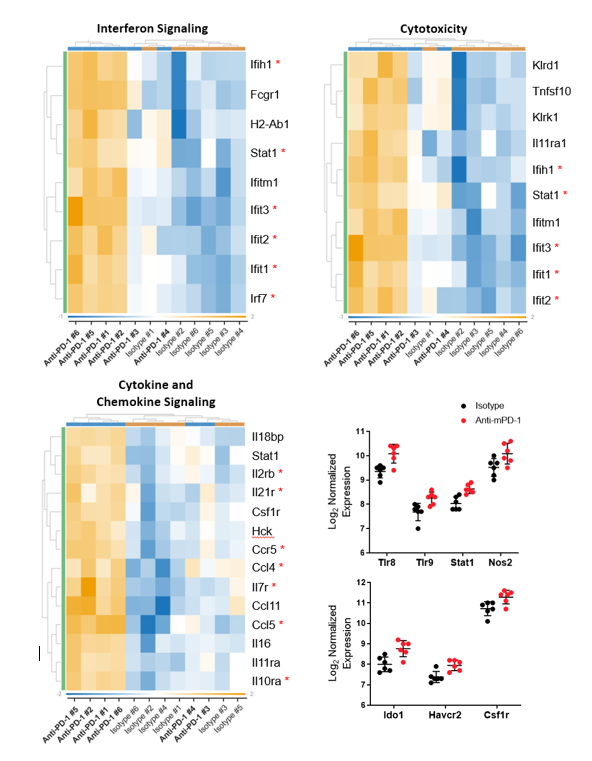
Figure 3. Transcriptomic analysis of differentially expressed genes in MB49 tumors from anti-mPD-1 treated mice compared to control animals. Raw gene counts were Log2 transformed and normalized against 20 housekeeping genes. Criteria for differential expression was ±1,5 fold change with p < 0.05. * denotes genes discussed in the text.
Zusammenfassung
Taken together, we used transcriptomic profiling to assess how anti-mPD-1 treatment altered gene expression related to the interplay between the immune response and the TME in the MB49 bladder cancer model. Combined with flow analysis of tumor-infiltrating immune cells, transcriptomics provided in depth and comprehensive mechanistic insight into anti-mPD-1 treatment-induced tumor growth inhibition.
Flow analysis confirmed CD8+ T cell infiltration was increased in anti-mPD1 treated mice compared to the control group. However, minimal effects were observed in most of the other biomarkers that were also targeted by the analysis. Remarkably, the IO 360™ panel complimented the flow cytometry data by providing non-redundant insight into the therapeutic engagement of several anti-tumor activities. Thus, NanoString analysis with the IO 360™ panel can be used to contribute to a rich dataset by uncovering mechanistic activity that might otherwise go unnoticed using other targeted approaches.
IO 360™ panel analysis revealed anti-mPD-1 treatment increased the expression of several genes implicated in T cell survival. Furthermore, among the cell surface activation markers measured, flow cytometry analysis revealed anti-mPD-1 upregulated ICOS on CD8+ T cells, which is a receptor demonstrated to promote T cell survival. The Ki-67 proliferation marker levels were not altered by anti-mPD-1 in CD8+ T cells. Thus, the effects of anti-mPD-1 treatment on CD8+ T cell infiltration may in part be due to ICOS-driven upregulation of T cell survival genes. Anti-mPD-1 also upregulated several genes that regulate STING pathway signaling, cytotoxic activity, and T cell recruitment. Thus, providing additional evidence that anti-mPD-1 drives transcriptional regulation of genes contributing to T cell anti-tumor responses. Genes associated with driving M1 TAM polarization were also upregulated by anti-mPD-1. Included in this list was Nos2 (iNOS), which was also confirmed by flow cytometry in tumor-derived macrophages, suggesting treatment enhanced some proinflammatory signals in the myeloid compartment in the TME to help combat tumor growth.
NanoString analysis also demonstrated that gene profiling can be used to identify combination treatment partners for future studies to achieve additive or synergistic results in vivo. One of the most eye-catching findings was the upregulation of genes in the treatment group coding for IDO1, TIM-3, and CSF1R, which provide signals that promote tumor growth and are also currently being targeted in various phases of clinical work. The modulation of these genes may be an alternate attempt by the tumor to evade the immune system as a result of the PD-1/PD-L1 blockade. Thus, combined treatment with anti-mPD-1 and either epacadostat, RMT3-23, or PLX5622 to inhibit IDO1, TIM-3, or CSF1R respectively in the MB49 tumor model may help to counteract the pro-tumor responses triggered by anti-mPD-1 treatment and improve efficacy. Studies to test these hypotheses are currently in design.
For more information about our NanoString capabilities, please visit: https://drugdevelopment.labcorp.com/industry-solutions/oncology/preclinical/in-vitro/dna-rna-expression-analysis.html
Verweise
1Amatore, F., Gorvel, L., & Olive, D. (2018). Inducible Co-Stimulator (ICOS) as a potential therapeutic target for anti-cancer therapy. Expert opinion on therapeutic targets, 22(4), 343-351.
2Kumar, V., Patel, S., Tcyganov, E., & Gabrilovich, D. I. (2016). The nature of myeloid-derived suppressor cells in the tumor microenvironment. Trends in immunology, 37(3), 208-220.
3Chen, Q., Sun, L., & Chen, Z. J. (2016). Regulation and function of the cGAS–STING pathway of cytosolic DNA sensing. Nature immunology, 17(10), 1142-1149.
4Lohard, S., Bourgeois, N., Maillet, L., Gautier, F., Fétiveau, A., Lasla, H., ... & Barillé-Nion, S. (2020). STING-dependent paracriny shapes apoptotic priming of breast tumors in response to anti-mitotic treatment. Nature communications, 11(1), 1-16.
5Emmerich, J., Mumm, J. B., Chan, I. H., LaFace, D., Truong, H., McClanahan, T., ... & Oft, M. (2012). IL-10 directly activates and expands tumor-resident CD8+ T cells without de novo infiltration from secondary lymphoid organs. Cancer research, 72(14), 3570-3581.
6Smith, G. A., Taunton, J., & Weiss, A. (2017). IL-2Rβ abundance differentially tunes IL-2 signaling dynamics in CD4+ and CD8+ T cells. Science signaling, 10(510).
7Koenen, P., Heinzel, S., Carrington, E. M., Happo, L., Alexander, W. S., Zhang, J. G., ... & Hodgkin, P. D. (2013). Mutually exclusive regulation of T cell survival by IL-7R and antigen receptor-induced signals. Nature communications, 4(1), 1-10.
8Vilgelm, A. E., & Richmond, A. (2019). Chemokines modulate immune surveillance in tumorigenesis, metastasis, and response to immunotherapy. Frontiers in immunology, 10, 333.
9Rauch, I., Müller, M., & Decker, T. (2013). The regulation of inflammation by interferons and their STATs. Jak-Stat, 2(1), e23820.
Note: All animal work is approved by the site Institutional Animal Care and Use Committee and was performed in conformance with the Guide for the Care and Use of Laboratory Animals within an AAALAC-accredited program. Humane euthanasia criteria are predetermined on all studies.
Unterhalten wir uns
Kontakt
Labcorp ist ein weltweit führendes Unternehmen im Bereich der Biowissenschaften, das Auftragsforschung und Entwicklungsdienstleistungen für die Branchen Pharma, Medizintechnik, Pflanzenschutz und Chemie anbietet.