Datum: Mai 2021
Labcorp Drug Development preclinical oncology offers the new mouse Expanded CompMyeloid™ panel, which provides deep immunophenotypic analysis into myeloid subsets known to regulate the tumor immune response.
The panel addresses the growing need to understand how immunotherapy modulates pro-tumor and anti-tumor activity in the myeloid compartment of the tumor microenvironment. In this Tech Spotlight, we demonstrate the power of this 18-color panel that provides a deep dive into myeloid subset immunophenotyping and functional characterization.
The Expanded CompMyeloid™ panel builds upon our CompMyeloid™ panel, which provides a general measurement of five myeloid subsets that regulate immunity in the tumor. The improved panel adds DC1 (type 1) and DC2 (type 2) dendritic cell delineation, plus six additional markers for functional characterization of tumor-associated macrophage (TAM), myeloid-derived suppressor cell (MDSC), and dendritic cell subsets. Table 1 describes the components of the Expanded CompMyeloid™ panel and Figure 1 illustrates the gating strategy for myeloid subset delineation using the murine Hepa 1-6 hepatocellular carcinoma model.
Table 1: Expanded CompMyeloid™ Panel Antibodies and Description of Their Utility
Antikörper / Farbstoff |
Beschreibung |
CD45 |
Pan Immunzellmarker |
CD11b |
Pan-myeloid lineage marker/DC2 subset marker |
CD103 |
DC1 subset marker |
Ly-6G |
Granulocytic-MDSC/ Neutrophil marker |
Ly-6C |
Monocytic-MDSC/Monocyte marker |
CD11c |
Dendritische Zellmarker |
CD24 |
Dendritic cell delineation |
F4/80 |
Pan-macrophage marker |
MHC-Klasse II |
M1 macrophage & dendritic cell marker |
CD206 |
M2 macrophage marker |
XCR1 |
Cross presenting/Migratory dendritic cell marker |
CD80 |
Reifungsmarker |
CD86 |
Reifungsmarker |
ARG1 |
Myeloid functional marker |
iNOS |
Myeloid functional marker |
PD-L1 |
T cell inhibitory signaling protein |
CD19 |
B cell marker |
Vitalitätsfarbstoff |
Ausschluss toter Zellen |
The Expanded CompMyeloid™ panel provides immunophenotypic analysis of 7 distinct myeloid subsets including G-MDSC/neutrophils, M-MDSC/monocyte subsets, M1 and M2 Macrophages, and DC1, DC2 and XCR1+ dendritic cell (DC) subsets. The analysis of 5 myeloid functional markers to profile dendritic cell, macrophage, and MDSC phenotypes is also provided.
|
|
Expanded CompMyeloid™ Panel Gating Strategy
In alignment with all Labcorp Drug Development Preclinical Oncology immunophenotyping panels, analysis begins with dead cell exclusion and subsequent CD45+ immune cell delineation. Gated on total CD11b+ cells, Figure 1A displays downstream MDSC and TAM analysis. Figure 1B demonstrates DC analysis that follows a meticulous gating strategy that first excludes macrophages, granulocytes, and B cells, which minimizes the risk that the DC measurement is compromised due to contamination by irrelevant and potentially autofluorescent cells. The exclusion gate then enables CD24 analysis (not shown) that helps delineate conventional DCs, which are generally classified by medium to high expression levels of CD11c and MHC class II. These conventional DCs include the CD103+ DC1 subset and the CD11b+ DC2 subset, which have been demonstrated to drive CD8+ and CD4+ T cell anti-tumor responses respectively 1. XCR1 expression has been documented by multiple groups as a marker for DCs with cross-presenting activity, a phenotype required for DC-mediated activation of CD8+ T cells 2.
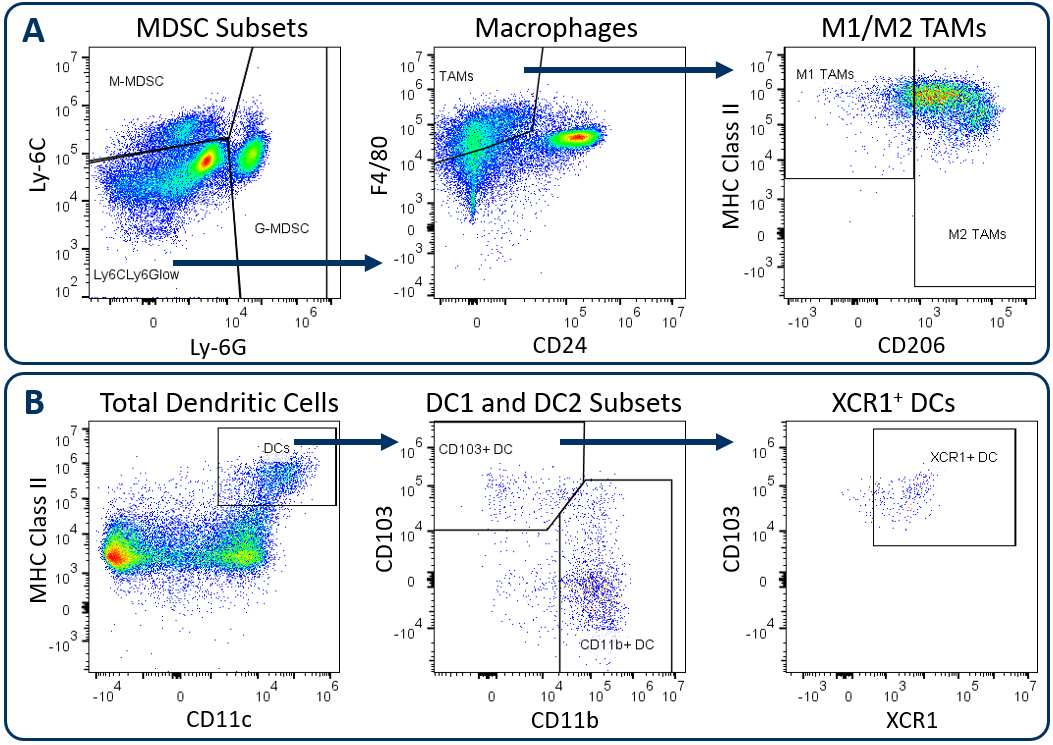
Figure. 1. Analysis of tumor-infiltrating myeloid subsets using the Expanded CompMyeloid™ panel. Hepa 1-6 tumors were harvested from C57BL/6 mice. (A) Starting from a CD11b+ cell gate, G-MDSC and M-MDSC subsets are measured and the remaining events are delineated into M1 and M2 TAMs, (B) Starting from a macrophage/MDSC exclusion gate, DC1 and DC2 subsets, and an XCR1+ DC fraction were measured.
All animal work is approved by the site Institutional Animal Care and Use Committee and was performed in conformance with the Guide for the Care and Use of Laboratory Animals within an AAALAC-accredited program. Humane euthanasia criteria are predetermined on all studies.
iNOS and Arginase 1 Analysis in MDSC and TAM Subsets
Myeloid subsets impart activity in the tumor microenvironment that have both pro-tumor and anti-tumor effects. The Expanded CompMyeloid™ panel provides an analysis of iNOS and Arginase 1 (ARG1); biomarkers that are examples of the duality of myeloid function. iNOS and ARG1 are expressed in both MDSC and TAM subsets in the tumor3. In MDSCs, both iNOS and ARG1 mediate an immunosuppressive effect by competing for the substrate L-arginine that fuels T cell proliferative and anti-tumor responses. Tumors that have high iNOS and ARG1 expression can cause an L-arginine deprived environment that leads to poor T cell activation. Thus, therapies that reduce the expression of iNOS and ARG1 in MDSCs have the potential to promote T cell activation and improve clinical outcome. Notably, iNOS expression can also inhibit tumor growth in a T cell-independent manner, as the nitric oxide gene product can have direct cytotoxic effects on tumor cells to inhibit disease progression. iNOS expressed by M1 polarized macrophages can induce growth arrest as well as induce apoptotic cell death in different models4,5. Conversely ARG1 expression by M2 polarized macrophages in the tumor microenvironment suppress T cell responses in a manner mechanistically similar to MDSCs.
Figure 2 demonstrates how the Expanded CompMyeloid™ panel can examine iNOS and ARG1 in myeloid subsets, using the subcutaneous Hepa 1-6 hepatocellular carcinoma model. We used this model because checkpoint inhibition via anti-PD-1 treatment inhibits tumor growth (not shown), thus providing an opportunity to examine how the myeloid compartment responds during checkpoint blockade. Compared to control animals, anti-PD-1 treatment increased the expression of both iNOS and ARG1 in tumor-infiltrating granulocytic (G-) and monocytic (M-) MDSC subsets (Figure 2A). In contrast, analysis of total TAMs demonstrated an increase in iNOS expression coinciding with a small but significant reduction in ARG1 expression (Figure 2B). Notably, within iNOS positive TAMs, there appear to be cells with a bi-phasic iNOS expression profile. Moreover, the expression of MHC class II is higher in the iNOShigh cell fraction indicating an enhanced capacity for antigen presentation and T cell activation. Being that iNOS and ARG1 are markers for M1 and M2 polarization respectively, the data suggest that anti-PD-1 treatment shifts the TAM balance toward M1 polarization and anti-tumor phenotype. The data are also a reminder that the tumor immune response is dynamic, and that immunotherapy can trigger multi-layered effects that push and pull between pro-tumor and anti-tumor activity.
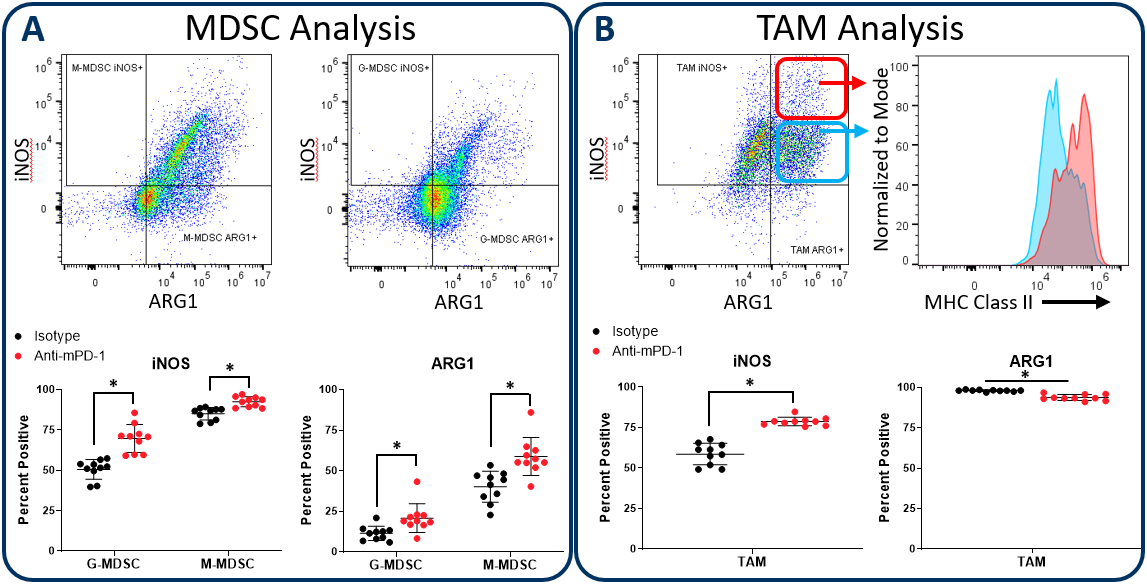
Figure 2. iNOS and arginase 1 analysis in MDSC and TAM subsets. The Expanded CompMyeloid™ panel measures biomarkers for myeloid functionality. In this data, Hepa 1-6 tumors were harvested from anti-PD-1 and isotype control antibody treated mice. MDSCs (A) and TAMs (B) were then delineated and analyzed for iNOS and ARG1 expression. TAMs differentially expressed relatively high (red circle enclosed) and low (blue circle enclosed) levels of iNOS expression, which directly correlated with MHC class II expression in these cell fractions, which is consistent with M1 polarization (red and green gates are representative examples and were not in this case used to generate the MHC class II measurement shown). * Student's T Test (p<0,05).
CD80 and CD86 Maturation Marker Expression on Conventional DC Subsets
Conventional dendritic cells at work in the tumor microenvironment can be divided predominantly into two subsets called DC1 and DC2, which are identified by expression of CD103/XCR1 and CD11b respectively. Both subsets can activate T cells. However, DC1 cells have been shown to favor CD8+ T cell activation due to an enhanced capacity for cross-presentation of tumor-associated antigens in the draining lymph nodes, a process that is regulated by XCR1 expression6. In the Hepa 1-6 study described above, the Expanded CompMyeloid™ panel was used to measure CD80 and CD86, which are costimulatory molecules expressed on antigen presenting cells and required for maximum T cell activation through a cell contact-dependent mechanism7. Figure 3 illustrates that both CD80 and CD86 are detectable on Hepa 1-6 tumor-derived dendritic cells. Furthermore, treatment with anti-PD-1 increased the expression levels of CD86 on the DC1 subsets compared to the isotype control group. The data suggest that enhanced T cell activation may be triggered by anti-PD-1 antibody treatment that is in part due to increased expression of CD86 on DC1 cells to enhance costimulatory activity in this subset.
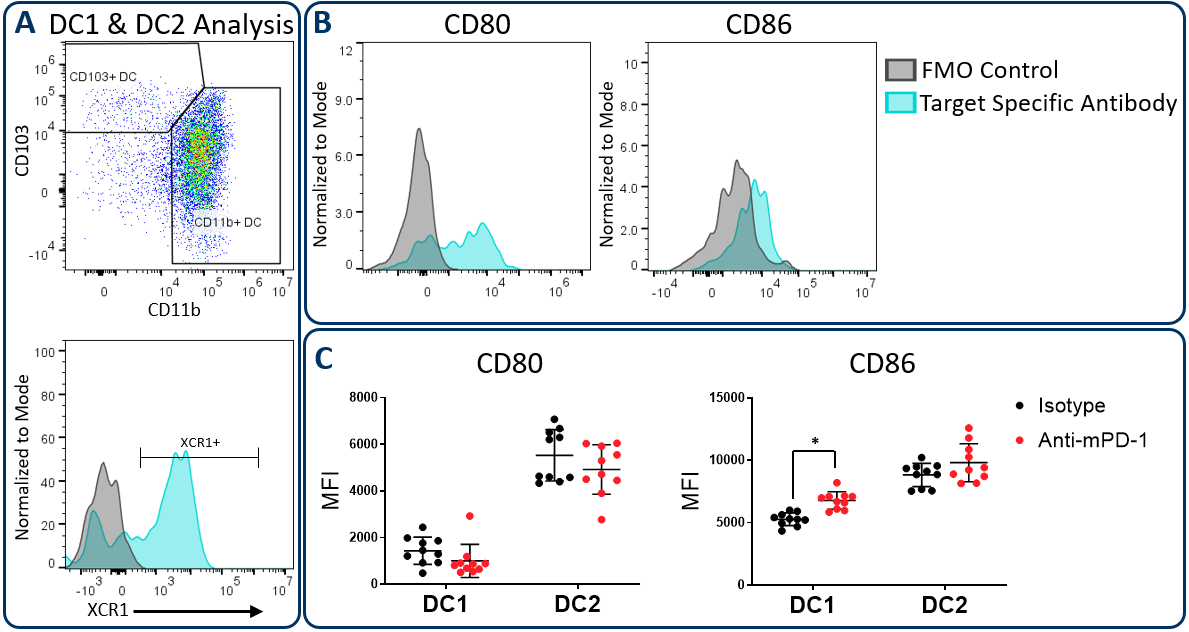
Figure 3. CD80 and CD86 maturation marker expression on DC subsets. The Expanded CompMyeloid™ panel was used to measure CD80 and CD86 in Hepa 1-6 tumor-derived cells. (A) Total DCs were first delineated and then phenotyped for DC1 and DC2 subsets. The gating strategy for XCR1 measurement is also shown. (B) Histograms to demonstrate representative CD80 and CD86 signals compared to the fluorescence minus one (FMO) negative control in DC1 cells. (C) CD80 and CD86 was measured in DC1 and DC2 subsets from Hepa 1-6 tumor-derived cells. * Student's T Test (p<0,05).
PD-L1 Analysis on Myeloid Subsets and Tumor cells
The PD-1/PD-L1 axis is one of the most widely targeted pathways in cancer immunotherapy. PD-L1 can be upregulated on tumor cells as a mechanism to evade host protective immunity. In addition, PD-L1 expression has been documented on myeloid cells including macrophages, dendritic cells, and MDSCs to further suppress T cell activation8. In some cases, PD-L1 expression in these distinct cell types can have non-redundant roles9. Together, these observations underscore the importance of understanding how PD-L1 expression in the myeloid compartment of the tumor can be modulated by immunotherapy. Figure 4 demonstrates the capability of the Expanded CompMyeloid™ panel to measure PD-L1 on total TAM, DC, G-MDSC/M-MDSC subsets, as well as CD45- (non-immune) cells, which include tumor cells, and also vascular endothelial and other cells. As shown below, PD-L1 is detectable in all cell types examined from Hepa 1-6 tumor-derived cells. The data also shows that compared to control animals, anti-PD-1 therapy had no effect on the levels PD-L1 expression in these cells, suggesting PD-L1 is not modulated by checkpoint inhibition in this model.
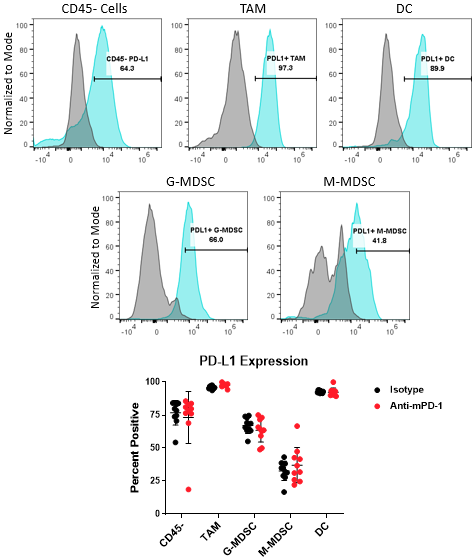
Figure 4. PD-L1 analysis on myeloid subsets and tumor cells. Histograms demonstrate representative PD-L1 signals compared to the fluorescence minus one (FMO) negative controls in CD45- cells and myeloid subsets from Hepa 1-6 tumor-derived cells. The gate shown was used to quantify the percentage of cells that are positive for PD-L1 expression in the indicated subsets contained in the isotype control and anti-PD-1 antibody treated groups.
With the use of the Expanded CompMyeloid™ panel, the data in this Tech Spotlight presents evidence that checkpoint inhibition modulates the immune activity in multiple myeloid subsets in the murine Hepa 1-6 tumor model. Furthermore, the data provides additional support that anti-PD1 treatment exerts effects that are not limited only to T cell activity.
To learn more about how the Expanded CompMyeloid™ panel can be incorporated into your preclinical research, contact the scientists at Labcorp Drug Development.
Verweise
1Gardner, A., & Ruffell, B. (2016). Dendritic cells and cancer immunity (Dendritische Zellen und Krebsimmunität). Trends in immunology, 37(12), 855-865.
2Wylie, B., Seppanen, E., Xiao, K., Zemek, R., Zanker, D., Prato, S., ... & Waithman, J. (2015). Cross-presentation of cutaneous melanoma antigen by migratory XCR1+ CD103− and XCR1+ CD103+ dendritic cells. Oncoimmunology, 4(8), e1019198.
3Kumar, V., Patel, S., Tcyganov, E., & Gabrilovich, D. I. (2016). The nature of myeloid-derived suppressor cells in the tumor microenvironment. Trends in immunology, 37(3), 208-220.
4Rahat, M. A., & Hemmerlein, B. (2013). Macrophage-tumor cell interactions regulate the function of nitric oxide. Frontiers in physiology, 4, 144.
5Vannini, F., Kashfi, K., & Nath, N. (2015). The dual role of iNOS in cancer. Redox biology, 6, 334-343.
6Wylie, B., Seppanen, E., Xiao, K., Zemek, R., Zanker, D., Prato, S., ... & Waithman, J. (2015). Cross-presentation of cutaneous melanoma antigen by migratory XCR1+ CD103− and XCR1+ CD103+ dendritic cells. Oncoimmunology, 4(8), e1019198.
7Slavik, J. M., Hutchcroft, J. E., & Bierer, B. E. (1999). CD28/CTLA-4 and CD80/CD86 families. Immunologic research, 19(1), 1-24.
8Sun, C., Mezzadra, R., & Schumacher, T. N. (2018). Regulation and function of the PD-L1 checkpoint. Immunity, 48(3), 434-452.
9Oh, S. A., Wu, D. C., Cheung, J., Navarro, A., Xiong, H., Cubas, R., ... & Mellman, I. (2020). PD-L1 expression by dendritic cells is a key regulator of T-cell immunity in cancer. Nature Cancer, 1(7), 681-691.
Unterhalten wir uns
Kontakt
Labcorp ist ein weltweit führendes Unternehmen im Bereich der Biowissenschaften, das Auftragsforschung und Entwicklungsdienstleistungen für die Branchen Pharma, Medizintechnik, Pflanzenschutz und Chemie anbietet.